The topic of What Inference-Platform Benchmark Posts Leave Out is currently the subject of lively debate — readers and analysts are keeping a close eye on developments.
This is taking place in a dynamic environment: companies’ decisions and competitors’ reactions can quickly change the picture.
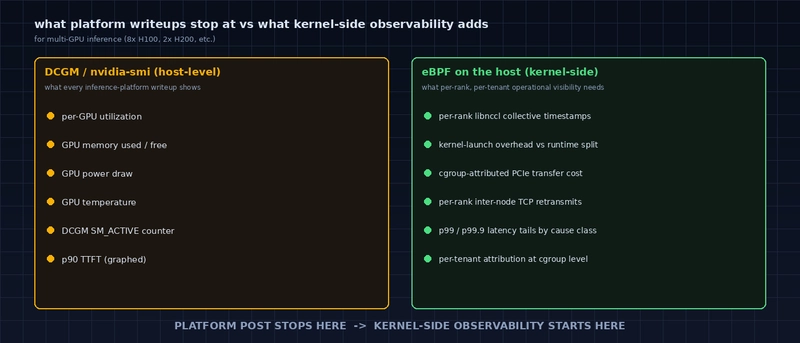
DCGM stops at host-level GPU counters. Kernel-side eBPF adds the per-rank, per-tenant signals platform writeups never publish.
Cloudflare’s recent post on hosting Kimi K2.5 and Llama 4 Scout opens with p90 Time-to-First-Token graphs and a round of throughput numbers. The piece is candid about the engineering work behind the gains. Like most inference-platform writeups, it is also structured around the metrics a hosting company can show externally. Three dimensions that matter operationally to anyone serving production inference – tail latency past p90, cross-rank skew on multi-GPU, and per-tenant attribution – are absent from the post. Below: why those gaps are normal, and what per-rank inference observability adds that host-level metrics do not.
For readers who want to inspect a real Ingero trace: an Echo AI-investigation DB (cluster-wide, MCP-over-DuckDB) captured during a recent multi-node fan-in demo is published at echo-fanin-demo.db (~1 MB, DuckDB format). It holds 2,000 events from two logical nodes, 80 causal chains preserved across the wire, and 18 stragglers detected end-to-end. Open it with duckdb echo-fanin-demo.db and SELECT * FROM events LIMIT 100; to see the raw rows, or query straggler-only events directly. The DB is not a per-rank NCCL capture, but it does ground the cross-node aggregation claim below: this is what real Ingero output looks like.
Standard fare for an inference-platform launch: model size, GPU count, headline latency.
p90 is the customer-friendly summary. Production reliability is set at p99 or p99.9. The user who waits 8 seconds for a response their previous 100 calls returned in 600 ms is the one who emails support. The shape of the tail determines whether retries help or hurt.
A throughput graph does not separate any of these. A p99 distribution broken out by cause does, but the cause-class breakdown needs per-rank, per-collective data underneath.
8 H100s sharing a 1T-parameter model means a tensor-parallel split, which means every forward pass terminates with an AllReduce barrier. The slowest rank dictates the wall-clock time of every token boundary. If one rank runs consistently 5% slower (NUMA placement, host-side noisy neighbor, thermal throttling), the whole serving rate drops 5%.
This is what eBPF observability is built for: uprobes on libnccl collective entry and exit symbols (ncclAllReduce, ncclBroadcast, ncclAllGather, …) record per-rank timestamps, and the output is a per-rank latency histogram and a slow-rank score per cluster. The Cloudflare post mentions multi-GPU configurations but no per-rank data, which is the right call for an external writeup and the wrong per-rank inference observability gap to leave operationally.
A single Cloudflare H100 hosts many tenants. When one tenant’s TTFT spikes, the attribution question is: did their request land on the slow GPU; was a colocated tenant burning host CPU; was the request routed through a saturated network leg? Every layer in the stack is multi-tenant.
The cgroup-level signal that links a kernel-mode event back to a tenant pid is the only data class that actually answers this. Host-level Prometheus metrics (the typical pull-mode stack) average across tenants and lose the signal at exactly the resolution it would matter.
1. Internal observability is operational, not customer-facing. Cloudflare’s site reliability engineers see the p99 distributions; their customers see the marketing graph. AWS, GCP, and Azure follow the same pattern for their inference services. It is not adversarial. Publishing per-rank histograms turns into per-tenant heat maps that compete for the operator’s attention and confuse the customer-facing story.
2. Multi-tenant attribution requires kernel-side data the platform may not have. A platform can publish per-tenant aggregates if it captures cgroup-aware events. Most inference platforms do not, because their existing observability stack is DCGM polling, which is host-level by design and was never asked for tenant attribution. Adding eBPF to the host is a kernel-module-class change for a production fleet, and the change-management overhead is real.
3. NCCL events are not surfaced by libnccl itself. NCCL ships profiling hooks (NCCL_PROFILER_*), but they require linking against a profiler shared object at process start and emitting to a target the platform chose. eBPF uprobes on libnccl symbols sidestep that: events come out without modifying the workload or restarting the process. Most platforms have not done this work yet.
These are not new ideas. The BPF observability community has been building these patterns for non-GPU systems for over a decade. Applying them to GPU collectives is a delta of about a year of focused engineering, and the result of that work is increasingly available as open source.
ingero-io/ingero is an open source eBPF agent that records the events listed above and emits them as OTLP. ingero-io/ingero-fleet is the cluster-side OpenTelemetry Collector distribution that aggregates them, computes per-rank skew thresholds using outlier-resistant statistics (Median Absolute Deviation), and pushes the threshold back to agents in the OTLP response so each rank can self-classify in real time without an extra polling round-trip. The full Fleet design is documented in docs/architecture_fleet.md.
The detection model is the one a platform-side site reliability engineer would build internally. The difference is that it runs on the customer’s own infrastructure, attributes signals to the customer’s own workloads, and emits OTLP that plugs into Prometheus, Grafana Cloud, Datadog, or whichever stack a team already has.
The DB referenced at the top of this post lives in the public Fleet repo at ingero-io/ingero-fleet/investigations/echo-fanin-demo.db so you can fetch it without a sign-up. It is an Echo AI-investigation DB from a multi-node demo, not a per-rank NCCL trace; the per-rank capability is described above and the DuckDB rows in this file demonstrate the cross-node aggregation half of the story.
If you are running multi-GPU inference and want the per-rank inference observability your platform is not surfacing, the install is one binary plus a Helm chart.
Two paths, depending on whether you want to run the demo end-to-end or just inspect the recorded output.
Reproduce the fan-in scenario from scratch. The integration test in cmd/ingero-echo/integration_test.go spins up Echo backed by a fresh DuckDB in a per-test temp directory, fans in 8 concurrent agents pushing 250 events each (2,000 events total), and asserts that all events landed, the planted outlier surfaces in the MCP query, and causal-chain events are preserved with all attributes. Each invocation produces its own DB.
The test takes under 10 seconds on a developer laptop. Requirement: a Go toolchain plus DuckDB’s CGO build dependencies (libstdc++).
To inspect the populated DB after the test runs, set ECHO_BLOG_ARTIFACT=1 in the environment and the test will copy the final DB to /tmp/echo-fanin-demo.db. Then:
Run any of the queries from the recorded-DB section below against this freshly captured DB; the schema is identical, only the random event IDs differ.
Inspect the recorded demo DB without running anything. The DB referenced at the top of this post is the populated output of one such run, captured from a real Lambda Cloud session (A100 us-east-1 plus a stress client emitting causal-chain-shaped events from a second logical node). 2,000 events, 2 clusters, 80 causal chains preserved across the wire, 18 stragglers detected end-to-end.
The Echo schema is documented in cmd/ingero-echo/store/schema.go: one row per OTLP data point, dedicated columns for cluster_id / node_id / metric_name / rank / nranks / value_double / value_int, and an attrs VARCHAR holding the rest as JSON. Two indexes target the most-used filters ((cluster_id, timestamp_ns) and (node_id, timestamp_ns)).
The two paths are independent: the test reproduction does not read the recorded DB, and the recorded DB does not require the test to be run. Both demonstrate the same Echo schema, so a query that works on one works on the other.
Ingero – open-source eBPF agent for GPU debugging. One binary, zero deps, <2% overhead. Apache 2.0 + GPL-2.0. *GitHub ⭐** · Open an issue if you are running multi-GPU inference and want the per-rank, per-collective view your platform is not surfacing.
Investigation DB: investigations/echo-fanin-demo.db*
Are you sure you want to hide this comment? It will become hidden in your post, but will still be visible via the comment’s permalink.
For further actions, you may consider blocking this person and/or reporting abuse
DEV Community — A space to discuss and keep up software development and manage your software career
Built on Forem — the open source software that powers DEV and other inclusive communities.
Why it matters
News like this often changes audience expectations and competitors’ plans.
When one player makes a move, others usually react — it is worth reading the event in context.
What to look out for next
The full picture will become clear in time, but the headline already shows the dynamics of the industry.
Further statements and user reactions will add to the story.