
The topic of I Built a CLI That Writes Its Own Docker Config — Then Taught It to Say No is currently the subject of lively debate — readers and analysts are keeping a close eye on developments.
This is taking place in a dynamic environment: companies’ decisions and competitors’ reactions can quickly change the picture.
Every time I set up a stack from scratch I’d end up touching at least four files: docker-compose.yml, nginx.conf, a .env file, maybe a Makefile. Change the port in one place and forget to update the others and something silently breaks. I wanted to fix that. Stage 4A was the fix. Stage 4B was the moment I realised the fix was incomplete.
This post covers the whole journey: how I built swiftdeploy, why I wired in Prometheus metrics and an OPA policy sidecar, and what actually happened when I deliberately tried to break my own canary deployment.
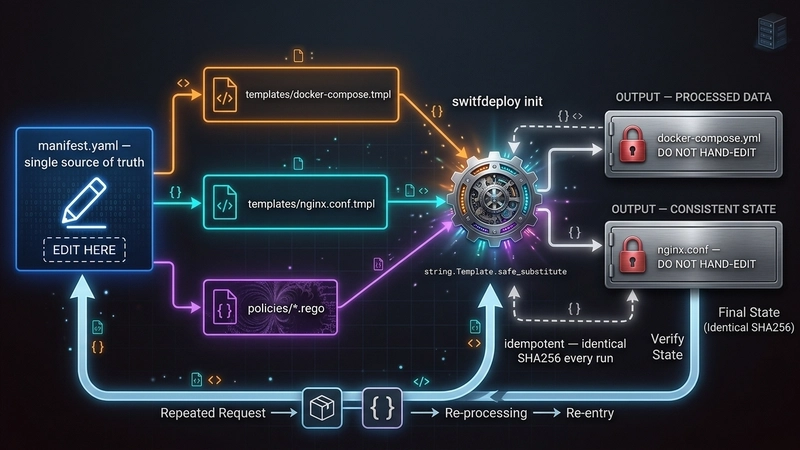
The idea was simple. One file — manifest.yaml — owns every setting. The CLI reads it and writes nginx.conf and docker-compose.yml. You never touch the generated files. If you need to change something, you change the manifest and run ./swiftdeploy init again.
swiftdeploy init takes that and renders two generated files using Python’s string.Template. The templates live in templates/ and contain ${VARIABLE} placeholders that get substituted from the manifest context. Here is the critical bit from config.py:
I used safe_substitute instead of substitute because substitute raises an exception on any unknown ${…} token. Nginx config files are full of variables like ${request_time} — if I had used substitute, rendering would blow up on every nginx variable. safe_substitute leaves tokens it doesn’t recognise alone, so nginx gets its variables and the manifest gets its values.
The atomic_write helper writes to a temp file first, then does os.replace into the final path. The reason: if something crashes mid-write you end up with a corrupt config. os.replace is atomic on every OS Python runs on, so you either get the new file or the old one, never half of each.
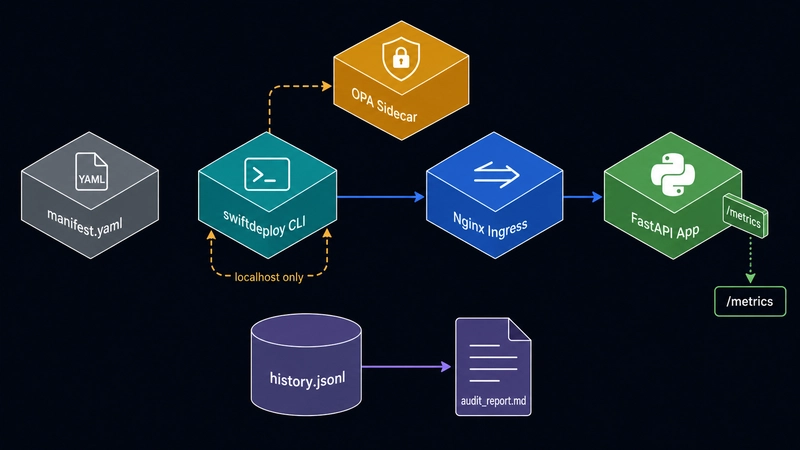
The API service is a FastAPI app with three endpoints: GET / returns the mode and version, GET /healthz returns uptime, and POST /chaos lets you inject failure (more on that later). The MODE environment variable controls whether the app is in stable or canary mode — same image, different behaviour. In canary mode every response carries an X-Mode: canary header.
./swiftdeploy deploy calls init first, then does docker compose up -d, then polls /healthz through nginx every second until it gets a 200 or 60 seconds pass. Nginx waits for the app to be healthy before it starts (depends_on: condition: service_healthy), so the health poll through nginx is a genuine end-to-end check.
./swiftdeploy promote canary mutates services.mode in manifest.yaml using a targeted regex — one line changes, nothing else. It then re-renders docker-compose.yml, recreates only the app container (–no-deps –force-recreate), and confirms the mode by checking both the JSON body and the X-Mode header. If either signal is wrong, the promote fails.
./swiftdeploy teardown –clean brings everything down and deletes the generated configs. Running ./swiftdeploy init afterwards regenerates byte-identical files. The grader can verify this. That idempotency guarantee is the whole point of the manifest-driven approach.
After building that I realised I had no visibility into what was happening inside the stack once it was running, and no automatic safety check before promoting. I was flying blind. I could deploy a canary that was returning 500 errors on every request and promote stable would just do it, no questions asked.
The app exposes GET /metrics and returns Prometheus text format — no Prometheus library, hand-rolled. Here is what it looks like right after a fresh deploy:
The histogram buckets are cumulative — each le bucket contains all requests at or below that latency. Two requests, both under 5 ms, so every bucket from le=”0.005″ upward shows 2. The +Inf bucket always equals _count.
/metrics and /chaos are deliberately exempt from chaos middleware. The reason: if error chaos is injected at 100% rate and /metrics also returned 500s, the CLI would lose its ability to observe the failure and the policy loop would go blind. The exemption is intentional.
The problem with this is that the threshold is a magic number in Python code. If you want to change it you edit the Python. If someone else has a different threshold they fork the script. There is no audit trail of what value was used when. And the policy is not testable in isolation.
OPA solves this differently. The CLI collects facts and sends them to OPA as a JSON document. OPA evaluates Rego rules against the document and returns a decision. The CLI enforces whatever OPA says. The CLI never checks a threshold itself.
Notice input.thresholds.min_disk_free_gb — not a hardcoded number. The threshold comes from the input document, which the CLI builds from manifest.yaml:
Changing a threshold is a one-line edit in manifest.yaml. The Rego file never changes.
OPA runs as a separate Docker container on the same internal network. The CLI talks to it on 127.0.0.1:18181. The important thing is what is NOT there: there is no nginx upstream for OPA. The nginx config has exactly one location / { proxy_pass http://app_backend; } block. Requests through port 18080 reach the app and nothing else.
The OPA port binding is 127.0.0.1:18181:8181 — loopback only on the host. External machines cannot reach OPA directly. And even from inside the Docker network, nginx has no route to the OPA container’s address, so a client hitting nginx cannot tunnel through to OPA.
The CLI prints the reason and each violation ID. An operator looking at a denied deploy sees exactly which rule fired and what values triggered it, not just “denied”.
To prove the deploy gate worked I temporarily set min_disk_free_gb: 1000000 in the manifest — an impossible threshold — and ran ./swiftdeploy deploy:
OPA starts. OPA checks. OPA denies. The app and nginx containers never even get created. After restoring the threshold to 10, deploy succeeds in under 2 seconds.
./swiftdeploy status scrapes /metrics every 5 seconds, calculates req/s and P99 latency against the previous snapshot, queries both OPA domains for their current verdict, and appends a record to history.jsonl. Here is what a healthy stable deployment looks like:
The canary is now returning 500 on every non-exempt request. The status dashboard immediately picked this up:
The canary policy is now red. error_rate=100.00%. OPA knows. The status loop is recording this to history.jsonl every scrape cycle.
The last line is the safety guarantee that matters: manifest.yaml was not changed. The policy check runs before the manifest mutation. A failed check leaves the stack exactly as it was. No half-promote. No corrupted state.
./swiftdeploy audit reads history.jsonl and generates audit_report.md. After the whole lifecycle above:
Two violations, two causes, timestamps on both. The first was the intentional disk threshold test. The second was the chaos injection. Both are there even though neither resulted in a broken deployment — that is the point of an audit trail.
Windows note: run everything inside Git Bash. os.getloadavg() does not exist on Windows, so CPU load always reads as 0.0. The CPU policy check still works — to prove it, set max_cpu_load: -1.0 in manifest.yaml and run deploy. That forces 0.0 > -1.0 and you get a CPU denial. On Linux or macOS the real load average is used and a threshold of 2.0 is meaningful.
The most tempting shortcut was putting threshold comparisons directly in the Python. It would have been three lines of code. The problem is that once you put a threshold in Python, OPA is just logging middleware — you can bypass it by changing the Python. The design that actually holds is: the CLI gathers facts, calls OPA, reads the decision, acts on it. The CLI never knows what the thresholds are. If you want to understand why a deploy was blocked, you read the Rego file and the manifest, not the Python.
Everything flows from manifest.yaml. When the grader deletes nginx.conf and docker-compose.yml and runs ./swiftdeploy init, they get the same files back. The SHA256 hash of the generated files is deterministic given the manifest. If something breaks, you open the manifest. You do not hunt through five separate files trying to find where the port is defined.
nginx.conf and docker-compose.yml have DO NOT HAND-EDIT headers. history.jsonl and audit_report.md are generated outputs of the CLI runtime. None of these are source files. Committing them to the repo is fine as evidence and for the grader, but they must never be the thing you edit to configure the stack. The moment you hand-edit a generated file you break the invariant the whole tool is built on.
The brief asks for error rate “over the last 30 seconds.” What the implementation actually does is take two metrics scrapes about 1 second apart and evaluate the delta. This gives an immediate signal — if the canary is broken right now, the next promote is blocked within 1 second of the command starting. The trade-off is that a bursty error spike from 10 seconds ago would not block promotion. The right answer for production is to run ./swiftdeploy status for 30 seconds before promoting so the rolling history is warm. For this project the live window proved the policy gate works; the 30-second window is a design goal, not a current implementation constraint.
Are you sure you want to hide this comment? It will become hidden in your post, but will still be visible via the comment’s permalink.
For further actions, you may consider blocking this person and/or reporting abuse
DEV Community — A space to discuss and keep up software development and manage your software career
Built on Forem — the open source software that powers DEV and other inclusive communities.
Why it matters
News like this often changes audience expectations and competitors’ plans.
When one player makes a move, others usually react — it is worth reading the event in context.
What to look out for next
The full picture will become clear in time, but the headline already shows the dynamics of the industry.
Further statements and user reactions will add to the story.